Jun 24, 2025
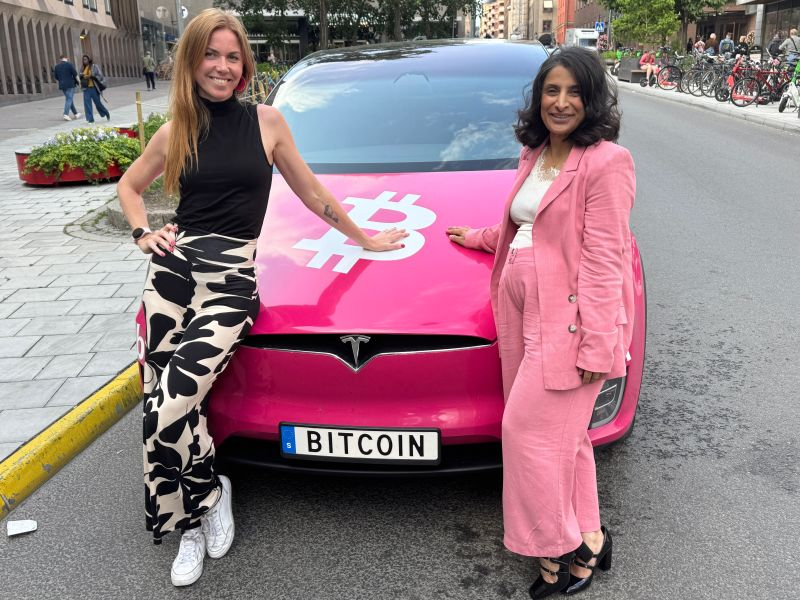
From Life Chaos to the Stage: Bitcoin for Busy Women at Nordic Blockchain Conference
What an incredible few days! On June 18–19, the voices of the future gathered at Nordic Blockchain Conference 2025 at Epicenter in Stockholm – and of course, we were there!
Jun 24, 2025
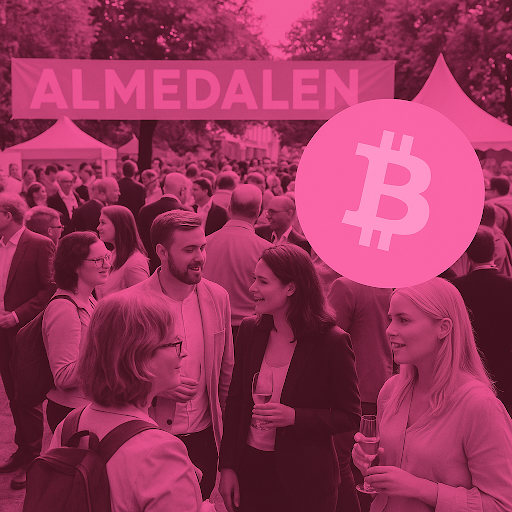
Bitcoin Takes the Stage in Almedalen – BTCX Opens the Conversation on the Future of Money
It’s time to bring Bitcoin into the political conversation — for real. And Almedalen Week 2025 is the perfect opportunity. BTCX’s founder and CEO, Christian Ander, is participating this week in two key panel discussions focused on the future of money, competition in the financial market, and — of course — how Bitcoin can help build a more open, fair, and inclusive economy.
Jun 24, 2025
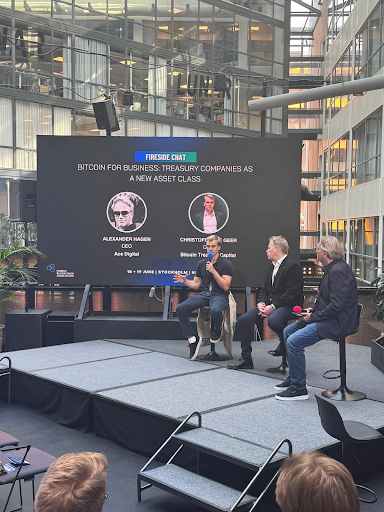
Bitcoin on the Balance Sheet – Now the Nordics Join the Game
More and more companies around the world are choosing to add Bitcoin to their balance sheets — and now we’re seeing the Nordics step into this global movement. At the Nordic Blockchain Conference in Stockholm on June 18–19, key players gathered to discuss the future of corporate Bitcoin reserves.
Jun 5, 2025
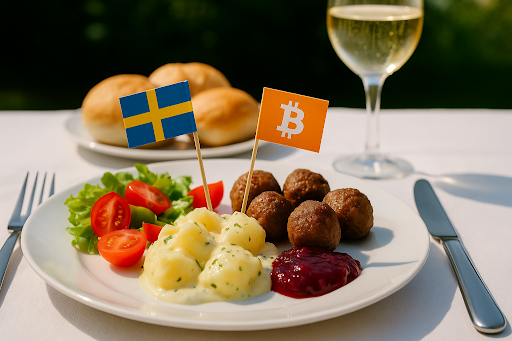
Bitcoin & Sweden’s National Day – A Freedom Question for Our Time
For many, June 6th is simply a red-marked day on the calendar. A chance to take the day off, gather friends for a barbecue, or raise the flag. But what are we really raising it for? What does freedom mean today – in a time when our money, data, and identity are becoming increasingly digital, centralized, and controlled?
Jun 4, 2025
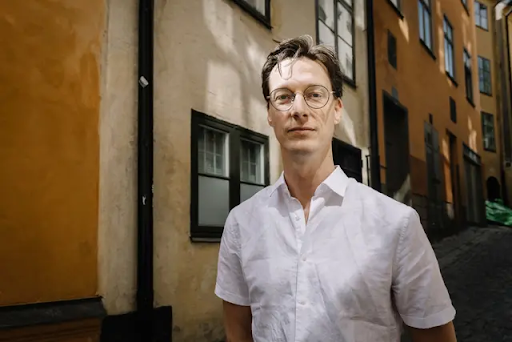
14 Years of BTCX – From Pioneer Site to Sweden’s Oldest Bitcoin Company
On June 15, 2011, Christian Ander hit “publish” – alone, surrounded by skeptics and polite smiles that said, “Good luck with that.” But he had an idea he couldn’t let go of: that Swedes should be able to buy Bitcoin as easily as they buy milk. And so, BTCX was born.
Jun 4, 2025
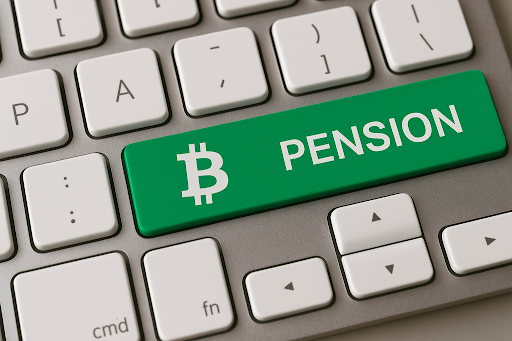
Bitcoin – The Pension Savings of the Future?
Cryptocurrencies like Bitcoin have long been seen as speculative investments. But things are changing: Bitcoin is starting to enter the financial mainstream – including the world of pension savings.
May 22, 2025
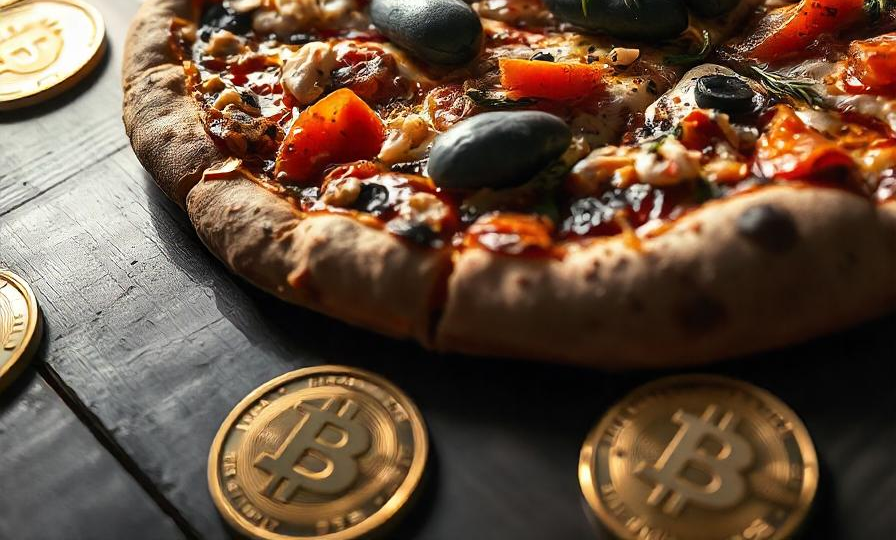
Bitcoin Pizza Day – A Bite That Changed the World
Every year on May 22, the Bitcoin community celebrates an iconic event that didn’t just satisfy a craving – it also put Bitcoin on the map as a real currency. Bitcoin Pizza Day isn’t just about eating pizza. It’s a symbol of innovation, belief in the future, and the human willingness to try something completely new.
May 21, 2025
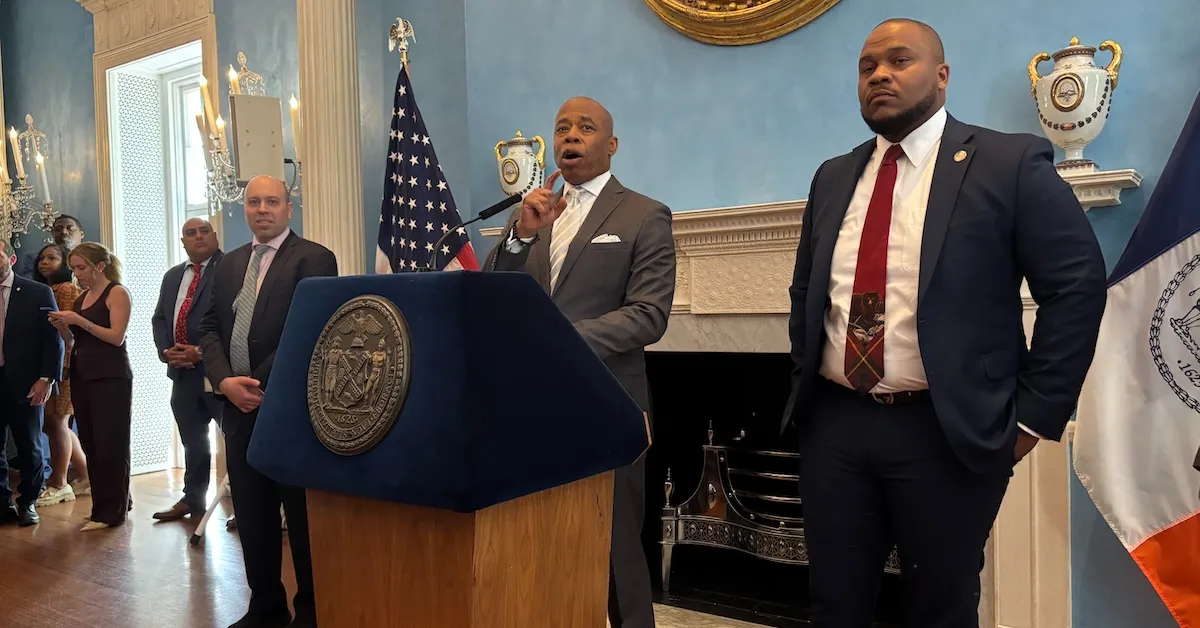
Bitcoin in Focus as New York Aims to Become Crypto-Friendly
On May 20, New York City hosted its first-ever crypto summit at the historic Gracie Mansion, where Mayor Eric Adams, together with the city’s CTO Matthew Fraser, gathered industry leaders and innovators to discuss the future of digital assets in the city that never sleeps. It’s a clear sign: even traditional power players at the highest political level in New York are now taking crypto seriously – especially Bitcoin.
May 19, 2025
Metaplanet strengthens its bitcoin strategy
The Tokyo-based investment firm Metaplanet, often referred to as Japan's answer to MicroStrategy, continues to make waves in the Bitcoin world. The company, which in 2024 decided to make Bitcoin a strategic reserve asset, has quickly become one of the most high-profile institutional names in Asia within crypto. On May 19, Metaplanet announced that it had purchased an additional 1,004 BTC, valued at approximately $104.3 million – their second-largest single purchase to date. This brings their total holdings to 7,800 BTC, equivalent to over $800 million at today’s value.
May 8, 2025
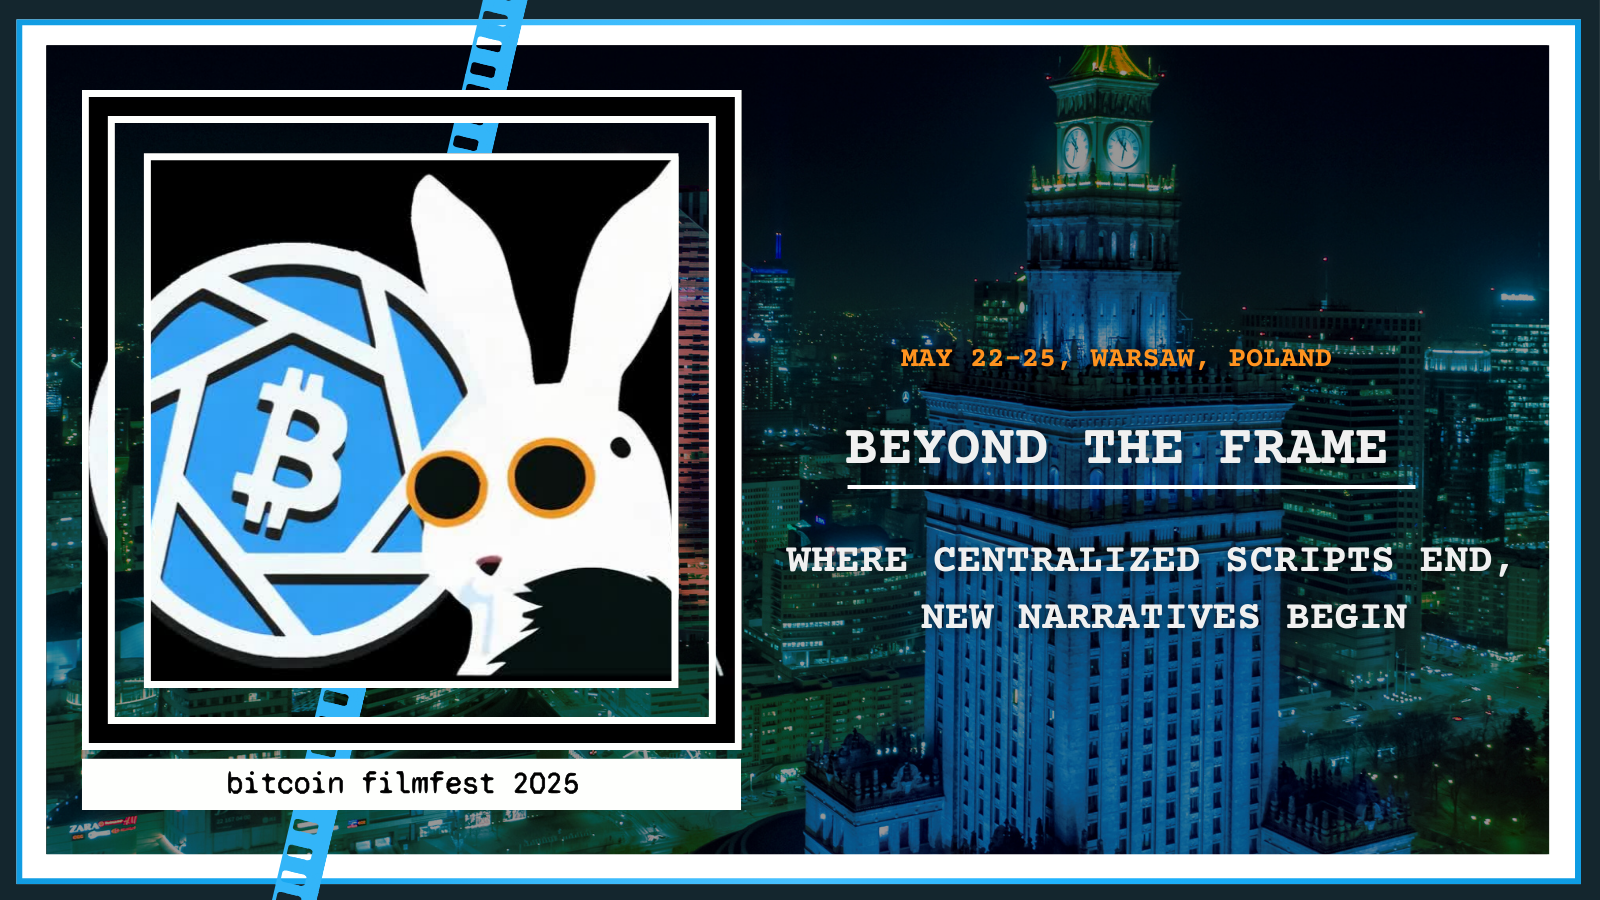
BTCX at Bitcoin FilmFest
Bitcoin meets film in a unique cultural event – and of course, BTCX will be there. From May 22–25, the Bitcoin FilmFest will take place in Warsaw, Poland. A must for anyone looking to combine their interest in Bitcoin with film, art, and networking. Plus, we’ve secured an exclusive discount code for our newsletter subscribers!